.svg)
.svg)

Get Started Quickly with Visualization, Data Prep and DAX on Power BI
For IT & Computer science Engineers
Course Type :
₹ 14295
Topic 1 | Introduction to Business Intelligence & Power BI
Topic 2 | What is Business Intelligence (BI)? & Data Analytics Lifecycle & BI tools comparison
Topic 3 | Excel, Tableau, Power BI
Topic 4 | Real-time industry use cases
Topic 5| Power BI Components Overview:
Topic 6 | Power BI Desktop, Power BI Service, Power BI Mobile
Topic 7 | Power BI Architecture
Introduction to Business Intelligence & Power BI
Topic 1| Power BI Desktop – UI & Data Loading
Topic 2 | Understanding Interface & Views
Power BI Desktop – UI & Data Loading
Topic 3 | Connecting to Data Sources:
Topic 4 | Excel, CSV, JSON, XML SQL Server & MySQL, Oracle SharePoint, Web data, REST APIs
Topic 5 | Data Source Refresh & Auto Refresh settings
Topic 6 | Import Mode vs Direct Query vs Composite Mode
Topic 1 |Power Query – Data Transformation
Topic 2 | Introduction to Power Query Editor
Topic 3 | Data Profiling and Quality checks
Power Query – Data Transformation
Topic 4 | Column operations
Topic 5 | Data Cleaning
Topic 6 | Conditional Columns
Topic 7 | Append vs Merge Queries
Topic 8 | Group By and Aggregate
Topic 9 | Introduction to M Language
Topic 10 | Hands-on Industry Dataset Cleaning
Topic 1 | Data Modeling & Relationships
Data Modeling & Relationships
Topic 1 | DAX (Data Analysis Expressions)
Topic 2 | Introduction to DAX
Topic 3| Measures vs Calculated Columns
Topic 4 | Important DAX Functions:
Topic 5 | Performance Optimization Tips
Topic 6 |
Topic 7 |
Topic 8|
Topic 9 |
DAX (Data Analysis Expressions)
Topic 1 | Creating Charts and Visuals in Power Bi
Topic 2| Using Visualizations & Formatting
Topic 3 |
Topic 4 |
Topic 5 |
Creating Charts and Visuals in Power Bi
Topic 1 | Advanced Charts
Topic 2| Gauge Chart
Topic 3 | KPI Chart
Topic 4 | Funnel Chart
Topic 5 | Ribbon Chart
Advanced Charts
Topic 1 | Power BI Service
Topic 2 |
Topic 3 |
Topic 4 |
Topic 5 |
Power BI Service
Topic 1| Power BI with SQL & Excel
Topic 2 |
Topic 3 |
Topic 4 |
Topic 5 |
Power BI with SQL & Excel
Topic 1 | Real-World Case Studies
Topic 2 |
Topic 3 |
Topic 4 |
Topic 5 |
Real-World Case Studies
Topic 1| Capstone Projects
Capstone Projects
Course Description
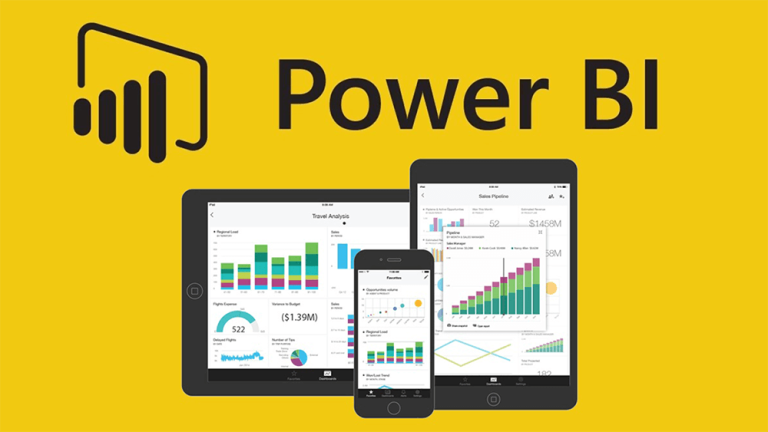
Power BI is a business analytics solution owned by Microsoft. Analysts use it for data visualization, draw insights from it, and share the dashboards and visual reports across the organization. Moreover, one can access these reports sitting at their workplace or anywhere through Power BI apps offered by Microsoft. Power BI is a collection of software services, apps, and connectors that work together to turn your unrelated sources of data into coherent, visually immersive, and interactive insights. Your data might be an Excel spreadsheet, or a collection of cloud-based and on-premises hybrid data warehouses.
Course Objective
Identify the primary components of the Power BI interface: reports, data, and model views. Import Excel data and build basic visuals. Understand basic concepts and terminology of the Power BI service. Find your content in dashboards, reports, and apps. View and export data from dashboards and reports. View filters that are used in a report. A Power BI report is a multi-perspective view into a dataset, with visuals that represent findings and insights from that dataset.
Person with knowledge in Power BI will get employed in following designations:
Course Highlights
Copyright © 2025 ABCTrainings - All rights reserved