.svg)
.svg)

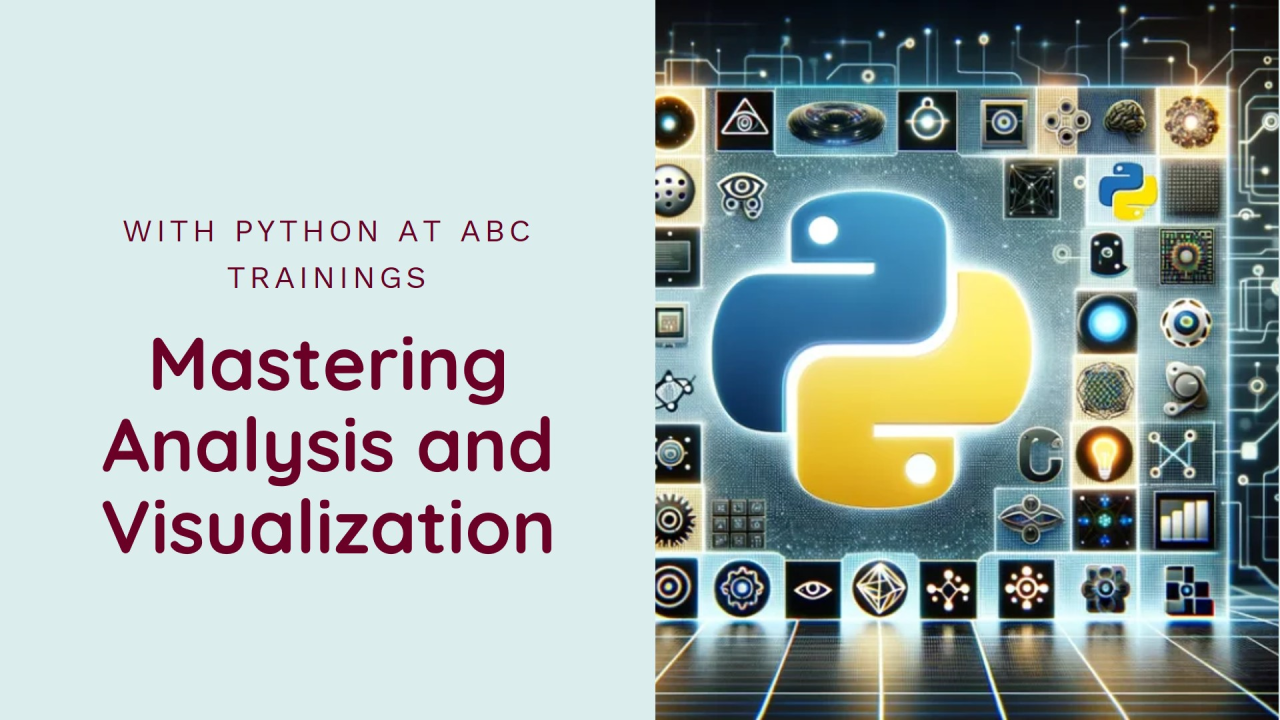
In today's data-driven world, the ability to extract meaning from information is a game-changer. Python, a versatile programming language, equips you with the tools to unlock the secrets hidden within data. This blog post is your gateway to the exciting realm of data analysis and visualization with Python, offered through ABC Trainings' comprehensive courses.
Unveiling the Power of Pandas
Your journey begins with pandas, a fundamental library for data manipulation. Pandas structures data into DataFrames, a spreadsheet-like format that simplifies organization and analysis. ABC Trainings' courses will teach you how to import data from various sources like CSV files with pandas. You'll learn to clean inconsistencies and perform calculations to prepare data for insightful visualizations.
Visual Storytelling with Matplotlib and Seaborn
Once your data is organized, it's time to bring it to life with visualizations. Matplotlib, a core Python library, offers a rich toolbox for creating various plots like bar charts, line graphs, and histograms. You can customize these plots with colors, labels, and titles to enhance clarity and effectively communicate trends or patterns. ABC Trainings' instructors will guide you through creating these visualizations in Matplotlib.
Seaborn, built on top of Matplotlib, provides a high-level interface for creating statistical graphics. It boasts a collection of aesthetically pleasing charts specifically designed to explore relationships between variables. Seaborn streamlines the visualization process, allowing you to create informative and visually captivating plots with minimal coding. ABC Trainings incorporates Seaborn into their curriculum, ensuring you can create impactful data stories.
Beyond the Basics
As you delve deeper, Python offers a plethora of additional libraries to cater to your specific data analysis needs. ABC Trainings exposes you to these possibilities, mentioning libraries like NumPy for numerical computations and Scikit-learn for machine learning tasks. This equips you to explore advanced data analysis techniques in the future.
Why Choose ABC Trainings for Python Data Analysis?
ABC Trainings offers unparalleled Python data analysis courses that set you apart:
Get Started Today!
Ready to embark on your data analysis adventure with Python? Here's what ABC Trainings offers:
Data analysis and visualization with Python empower you to transform raw numbers into stories that inform decisions and spark new discoveries. Enroll in an ABC Trainings course today and unleash the power of Python!
Join the ABC Trainings Community!
Expand your design and tech knowledge by following us on social media for daily tips, industry insights, and exclusive announcements.
Don't forget to share this article with your network!
By sharing valuable content, we can help more people develop their design and tech skills. Let's spread the knowledge together!
Copyright © 2025 ABCTrainings - All rights reserved